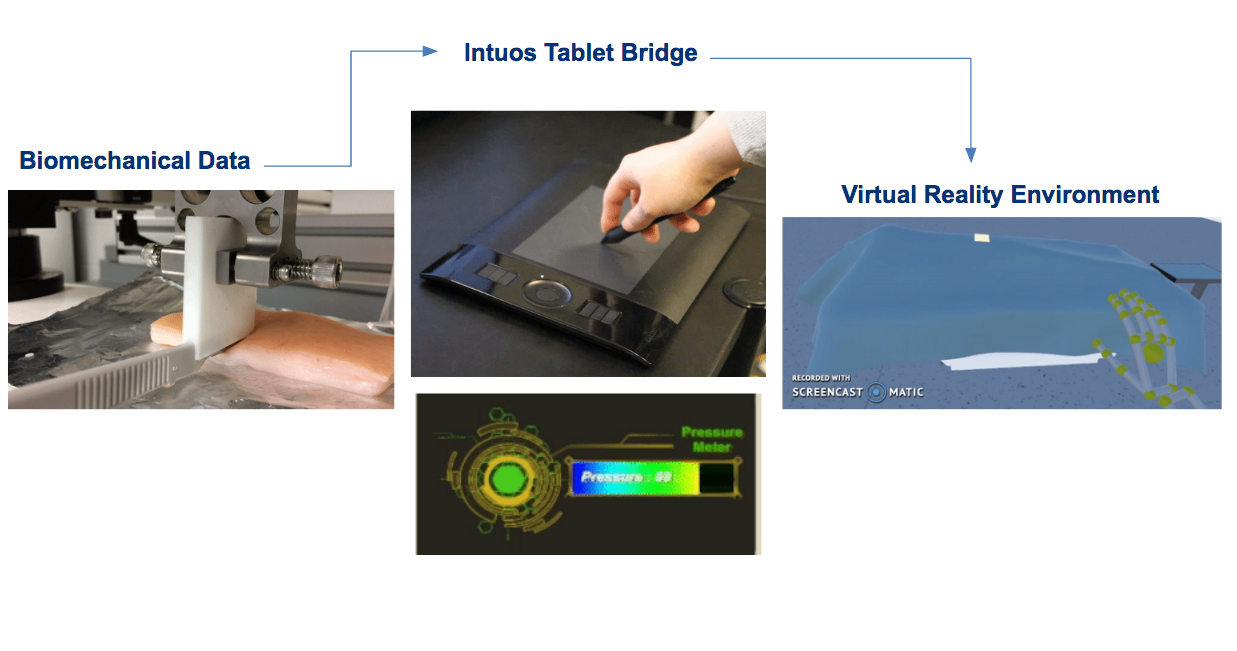
Why even bother collecting biomechanical data if it can’t be used? The biomechanical data is meant to be brought into the VR world, and serve as realistic training guidelines for the user. But how can this real-world information be brought into virtual reality…?
Intuos Tablet & Pen Calibration
Wacom’s Intuos Tablet and Pen seemed to be a perfect tool to use for this project as it is lightweight, portable, user-friendly and most importantly, the pen has pressure sensing capabilities. It was decided that the pen would represent a scalpel, and the tablet would serve as the area to be incised. With some javascripting, I was able to have the in-game scalpel be controlled by movement of the Wacom pen.
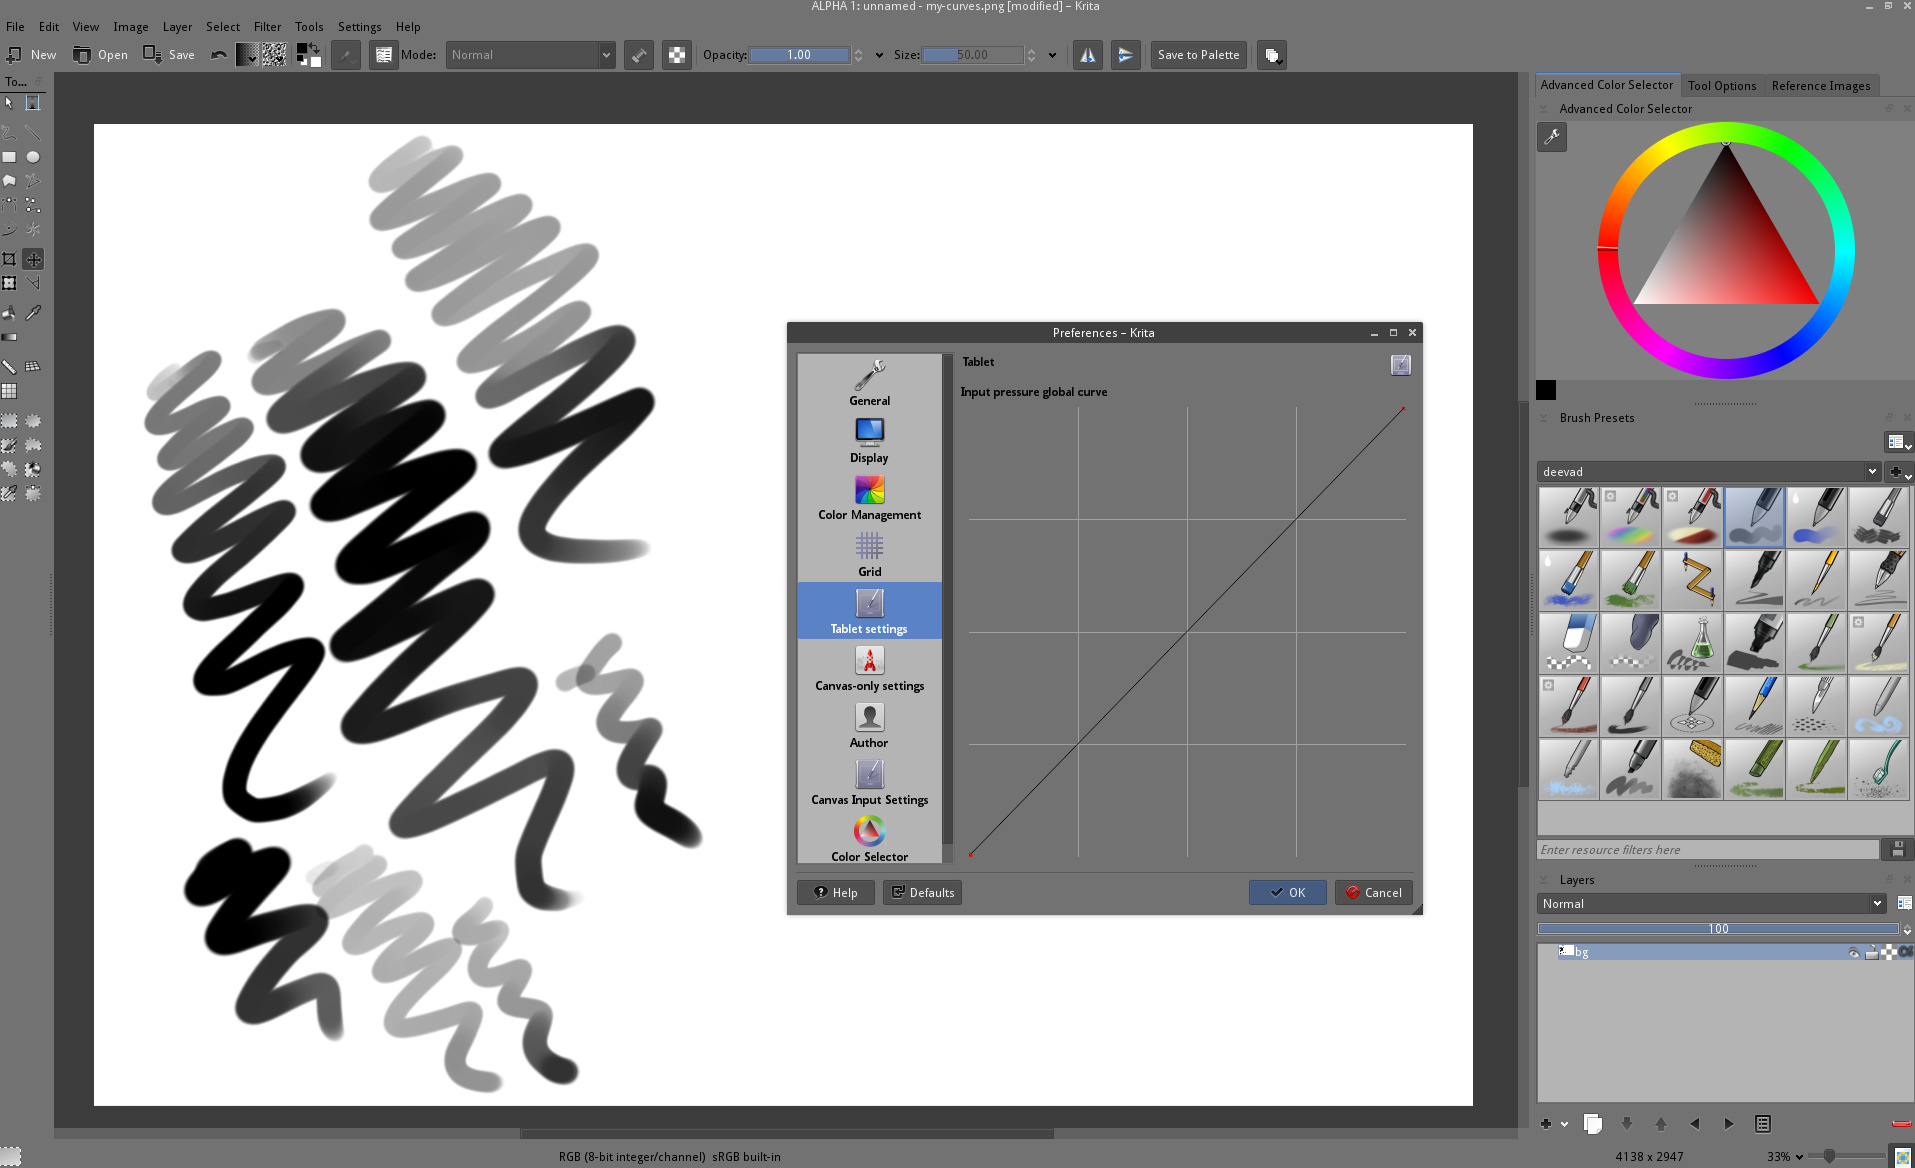
As the device is actually designed for and marketed towards artists, the applied pressure correlates with opacity; the more pressure the atist applies, the darker the color becomes on-screen. But how exactly does this happen - how does the tablet take it’s pressure reading and relate it to a level of opacity? A bit of tinkering with Wacom’s SDK revealed it to in fact be a numerical correlation, and these values I was able to display on screen as the pen hit the tablet at varying intensities, thanks to a few lines of C#.
Next was exploring the correlation between the tablets numerical readings, and the applied physical loads. The tablet was then strapped to the base of the Mark-10 instron, and the pen was clamped above it. The Mark-10 was programmed to apply compressive loads from 0.5N to 6N, in 0.5 intervals, and the numerical read-outs from the tablet were noted.
Unfortunately, through collecting all this data, a rather distrubing discovery was made …
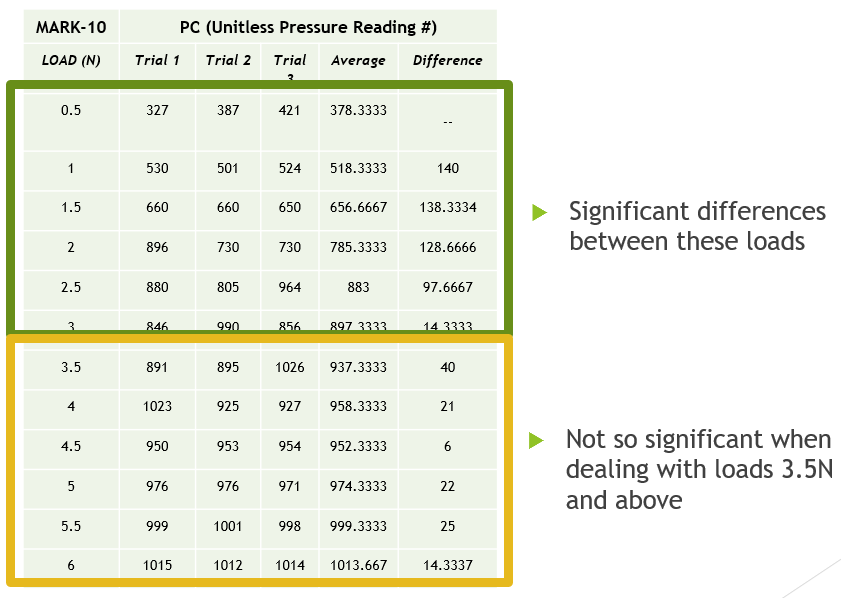
The tablet struggles to differentiate between applied loads greater than 3.5N. So unless the biomechanical data miraculously falls into this range, we’re going to need to make some changes.
Of course, there’s also the fact that this test needs to be redone with more data points, a moving average, etc. Additionally, a 3D printed component needs to be designed to hold the pen at different angles; in the above described experiment, the pen was held completely perpendicularly to the tablet, whereas scalpels are held nearly parallel to the area of interest during an operation. Thus collecting perpendicular data may not be the most accurate choice. This new test is scheduled for the end of December 2017.
Goldilocks Gauge
In any case, the next hurdle was to find a way to provide visual feedback to the user in regards to the force they’re applying via the pen. We decided that mimicking a typical game health-bar would be the best understood by a wide audience, and affectionately titled it the “Goldilocks Gauge.”
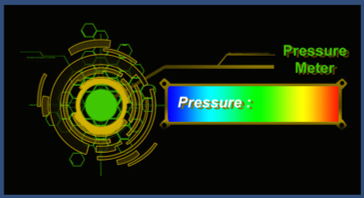
Do you know the story of Golidlocks and the 3 bears? This feedback gauge predominately incorporates three colors; red, green, and blue. If the user applies too much force while making an incision, the gauge will fill up to the red area. If on the other hand not enough force is applied, the gauge will stay in the blue area. If the “just right” (credits go to baby bear) amount of force is applied, the gauge will reach the green area. The best part about this gauge is that it’s dynamic; as the pressure changes while the user manipulates the pen, the gauge will respond at each moment without delay, until the user exits the program.
Next Steps:
- Details on drawing an incision (currently an incisin can be drawn, and prevents the user from haphazardly fooling around)